Simplifying Interest Gain Calculations with the EFFECT() Formula
This highlights how essential it is to have a dynamic and scalable tool that can adapt to real-world variables, such as changing interest rates and investment periods

I’ve been using Google Spreadsheets for almost 20 years, and created my first expense tracking spreadsheet in 2006.
I did so because it was cheaper (read: free) compared to paid software. Also, I love to tinker with spreadsheets!
With Google Sheets, I can easily integrate multiple financial spreadsheets together for a better overall picture of my finances.
The Challenge
Earlier this year I had the opportunity to invest some money outside the stock market, with a fixed interest rate.
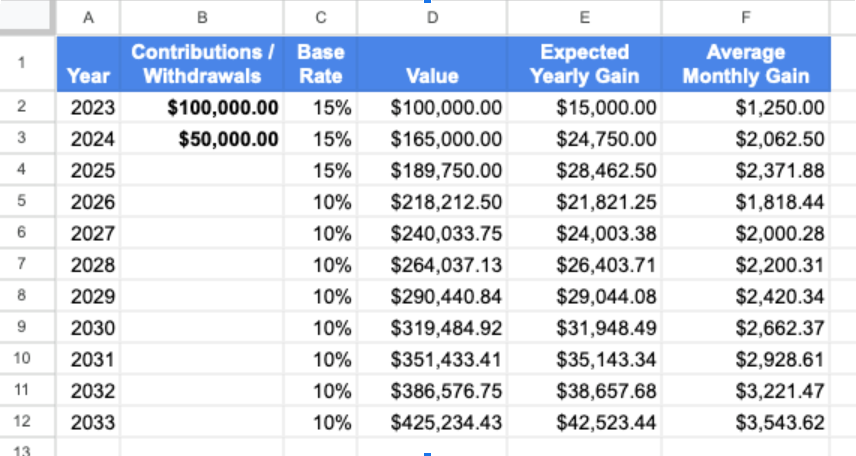
I wanted to project my potential gains in the coming years, but I wanted to display each year on a separate row. This way, I could get a sense of how much I would be gaining per month and year.
The end result is available via the FV() formula, which I could have used if I only cared about the final value after X number of years.
I wanted to see the amounts for each year however, and better yet, be able to change the interest rate for any given year. Because interest rates vary year to year in real life, I want my financial model to be as close to reality as possible. Not just a spreadsheet version of my wishes.
Begin With The Basics
I started by creating a basic sheet with a simple fixed interest rate calculation, where
I set this up for a 10 year period, and with the two initial contributions. This year’s contribution, and next year’s.

Add in Variable Compounding Frequencies
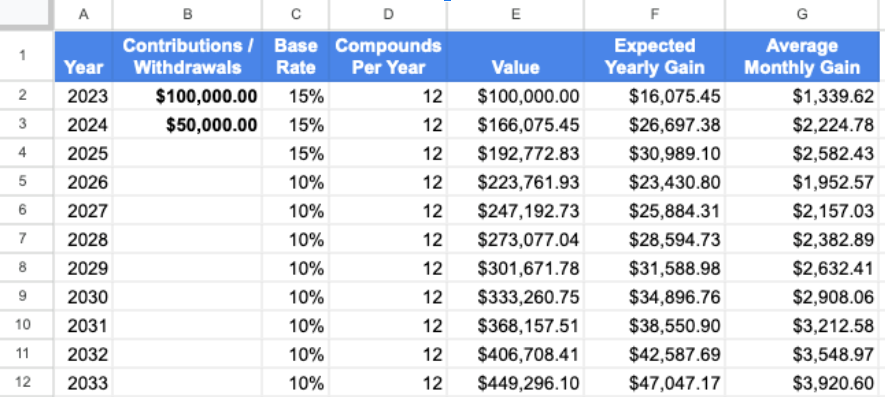
This worked fine for a very basic projection, but I wanted to add in the option for variable compounding frequencies.
I started with the compound interest formula
reformatted it for my sheet, and included a compounding frequency column.
I ended up with the formula
Specifically this is in cell F2, to calculate the expected gain.
I then copy/pasted down to the other rows.

Make It Scalable and Dynamic
That was better, but that still wasn’t good enough, as my 2023 effective interest rate wasn’t accurate on account of me having invested later in the year.
I had initially been using a hard-coded interest rate that I calculated based on the number of days the money would be invested, but as always, I wanted something dynamic. Something that was scalable.
So I added in columns for my investment start date, a potential withdrawal date, and added an extra column for the resulting effective rate.
Incorporating all of that into my “effective rate” formula was getting pretty messy though.
There must be a way to simplify this.
The “Effective” Solution
I thought, “I’m sure Google Sheets has something better for this”, and sure enough, after some quick googling, I stumbled on the EFFECT() function, which allowed me to simplify things quite a bit.
The syntax is really simple, taking in two variables, and outputting Annual Effective Interest Rate:
For example, if your interest rate for a given year is 10%, compounded monthly, the effective rate at the end of the year would end up at 10.47%.
So after replacing my formula “=(E2*(1+C2/D2)^D2)-E2” with the EFFECT() function, and incorporating the newly added columns, I ended up with the following formula for a more dynamic and better yet: a more accurate effective rate in column ‘G’:

Column ‘I’ then simply had to be modified to multiply column ‘H’ by the effective rate in column ‘G’, and I now had the dynamic template I wanted so that I could play with the numbers to forecast my (hopeful) future gains!
Simple + Effective = Accurate
If you’re like me and were using a manual formula for effective interest gain, consider the EFFECT() function instead, which might help you simplify your formula(s).
I’ve got a template of the above shared in case anyone wants to see exactly how it’s incorporated into my simple sheet, available free here: Sample Investment Gain Forecaster
Hope that helps someone else out there!
About Me
I'm Michael — an avid explorer with a passion for both travel and technology.
I run wheresbaldo.dev, a personal blog that serves as a canvas for my adventures across the globe and, more recently, my tech-driven escapades. On my blog, I share practical insights and valuable tips gained from years of traversing both physical and digital landscapes.
On the professional front, I serve as a web application developer, dedicating over two decades to constructing internal corporate web tools and spreadsheets. My expertise spans dynamic performance, KPI tracking, and analytical solutions utilising various web frameworks and tools.
If you’ve enjoyed this post, please check out the expanding tech section on my blog!
Thanks for reading,
Michael
Note: this is a guest post from Michael La Posta. If you'd like to guest write for Better Sheets please review what I'm looking for here.


