Organize Your Data! - Build a Kanban Board / Trello Board
Effortlessly organize tasks using Google Sheets! Learn impressive formulas, create Kanban/Trello boards, and optimize your life and workflow.

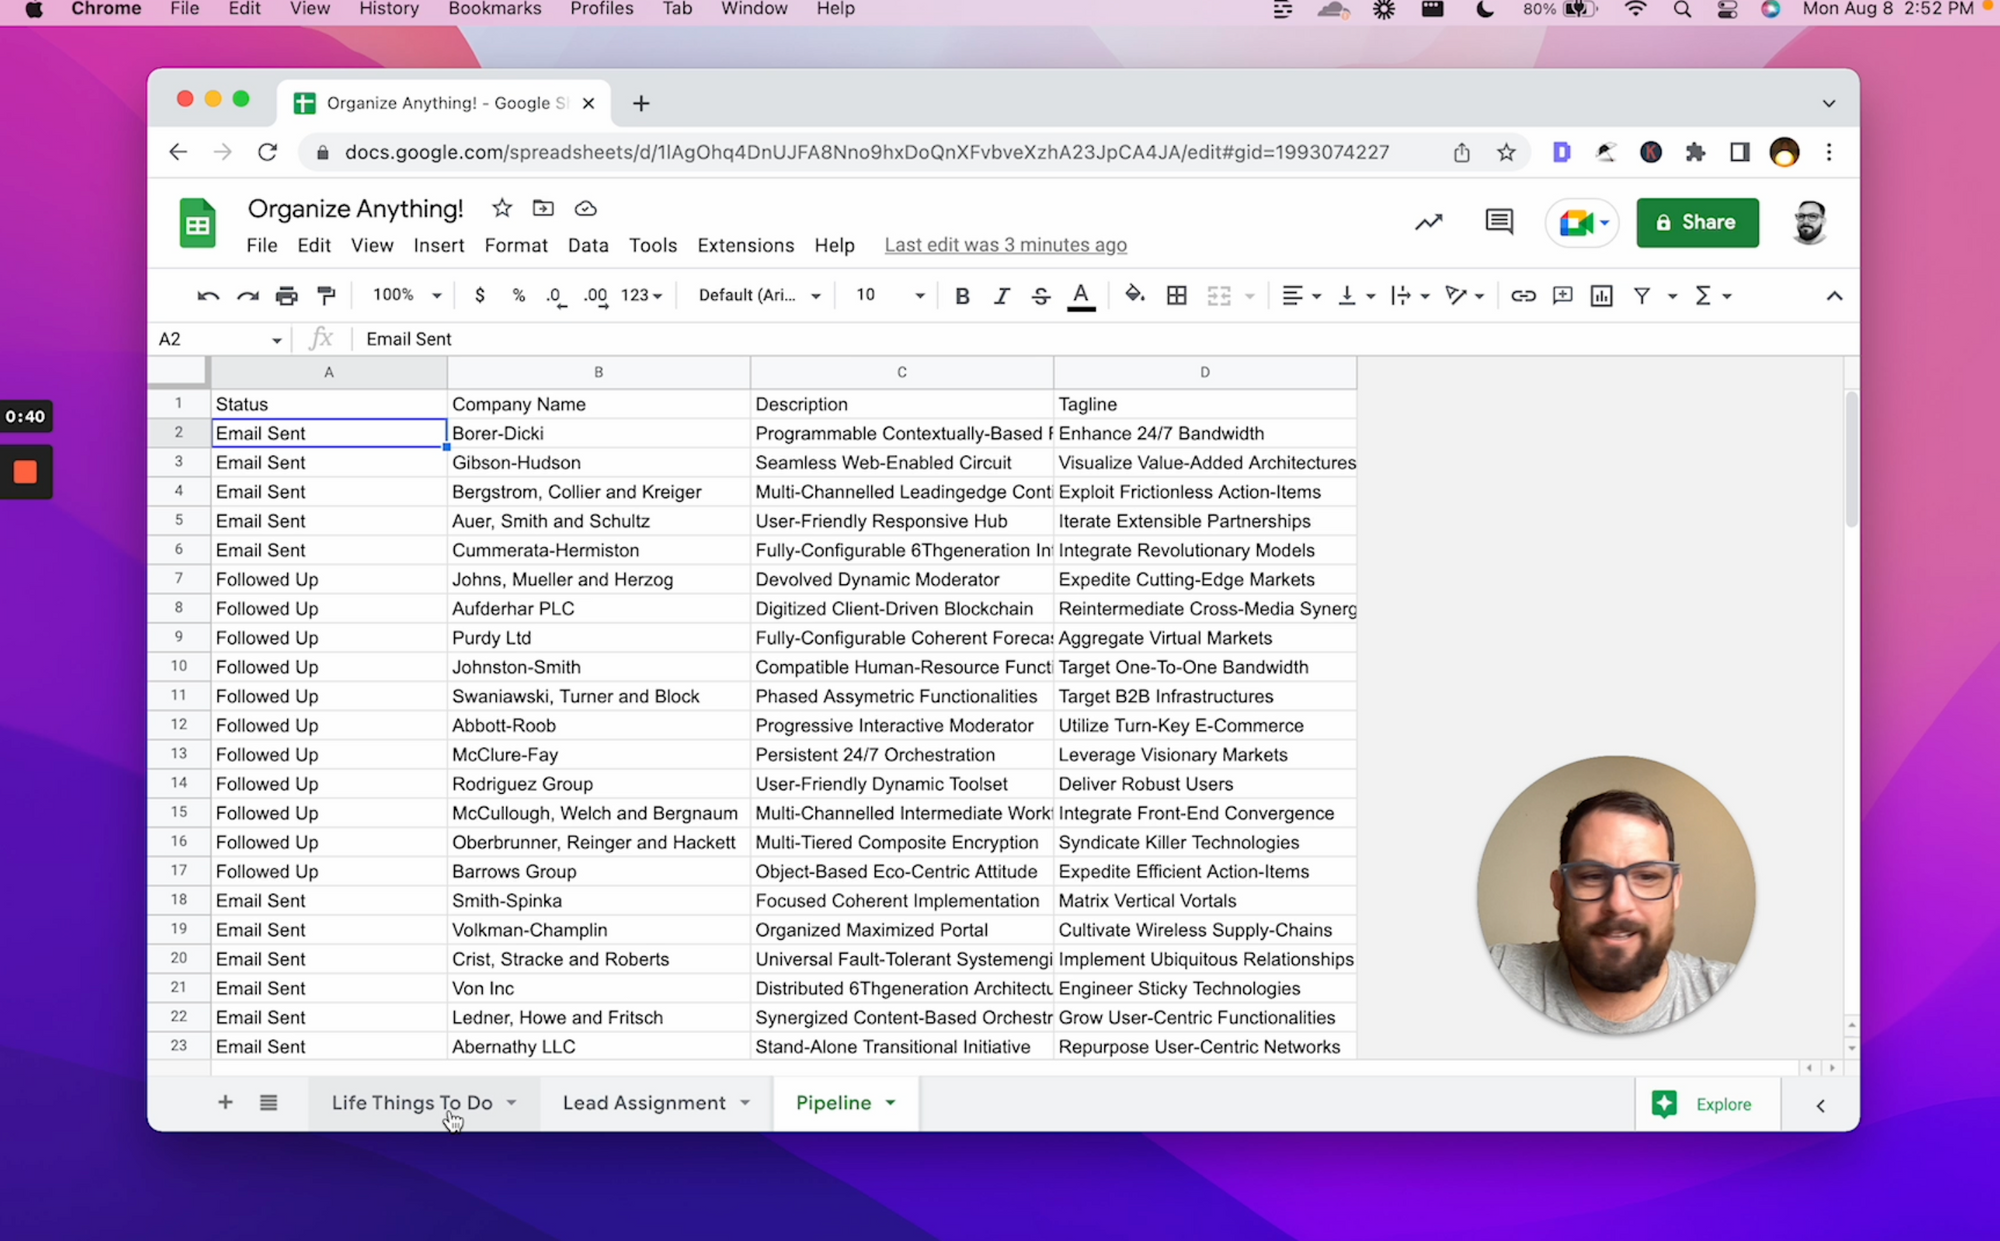
In this tutorial, we are going to organize anything. It's one of my favorite things to do, which is Kanban. “Kanban” is the Japanese word for billboard, but it's really a system that allows us to organize things.
We have three things we want to organize here:
- Life Things to Do
- Lead Assignment
- Pipeline
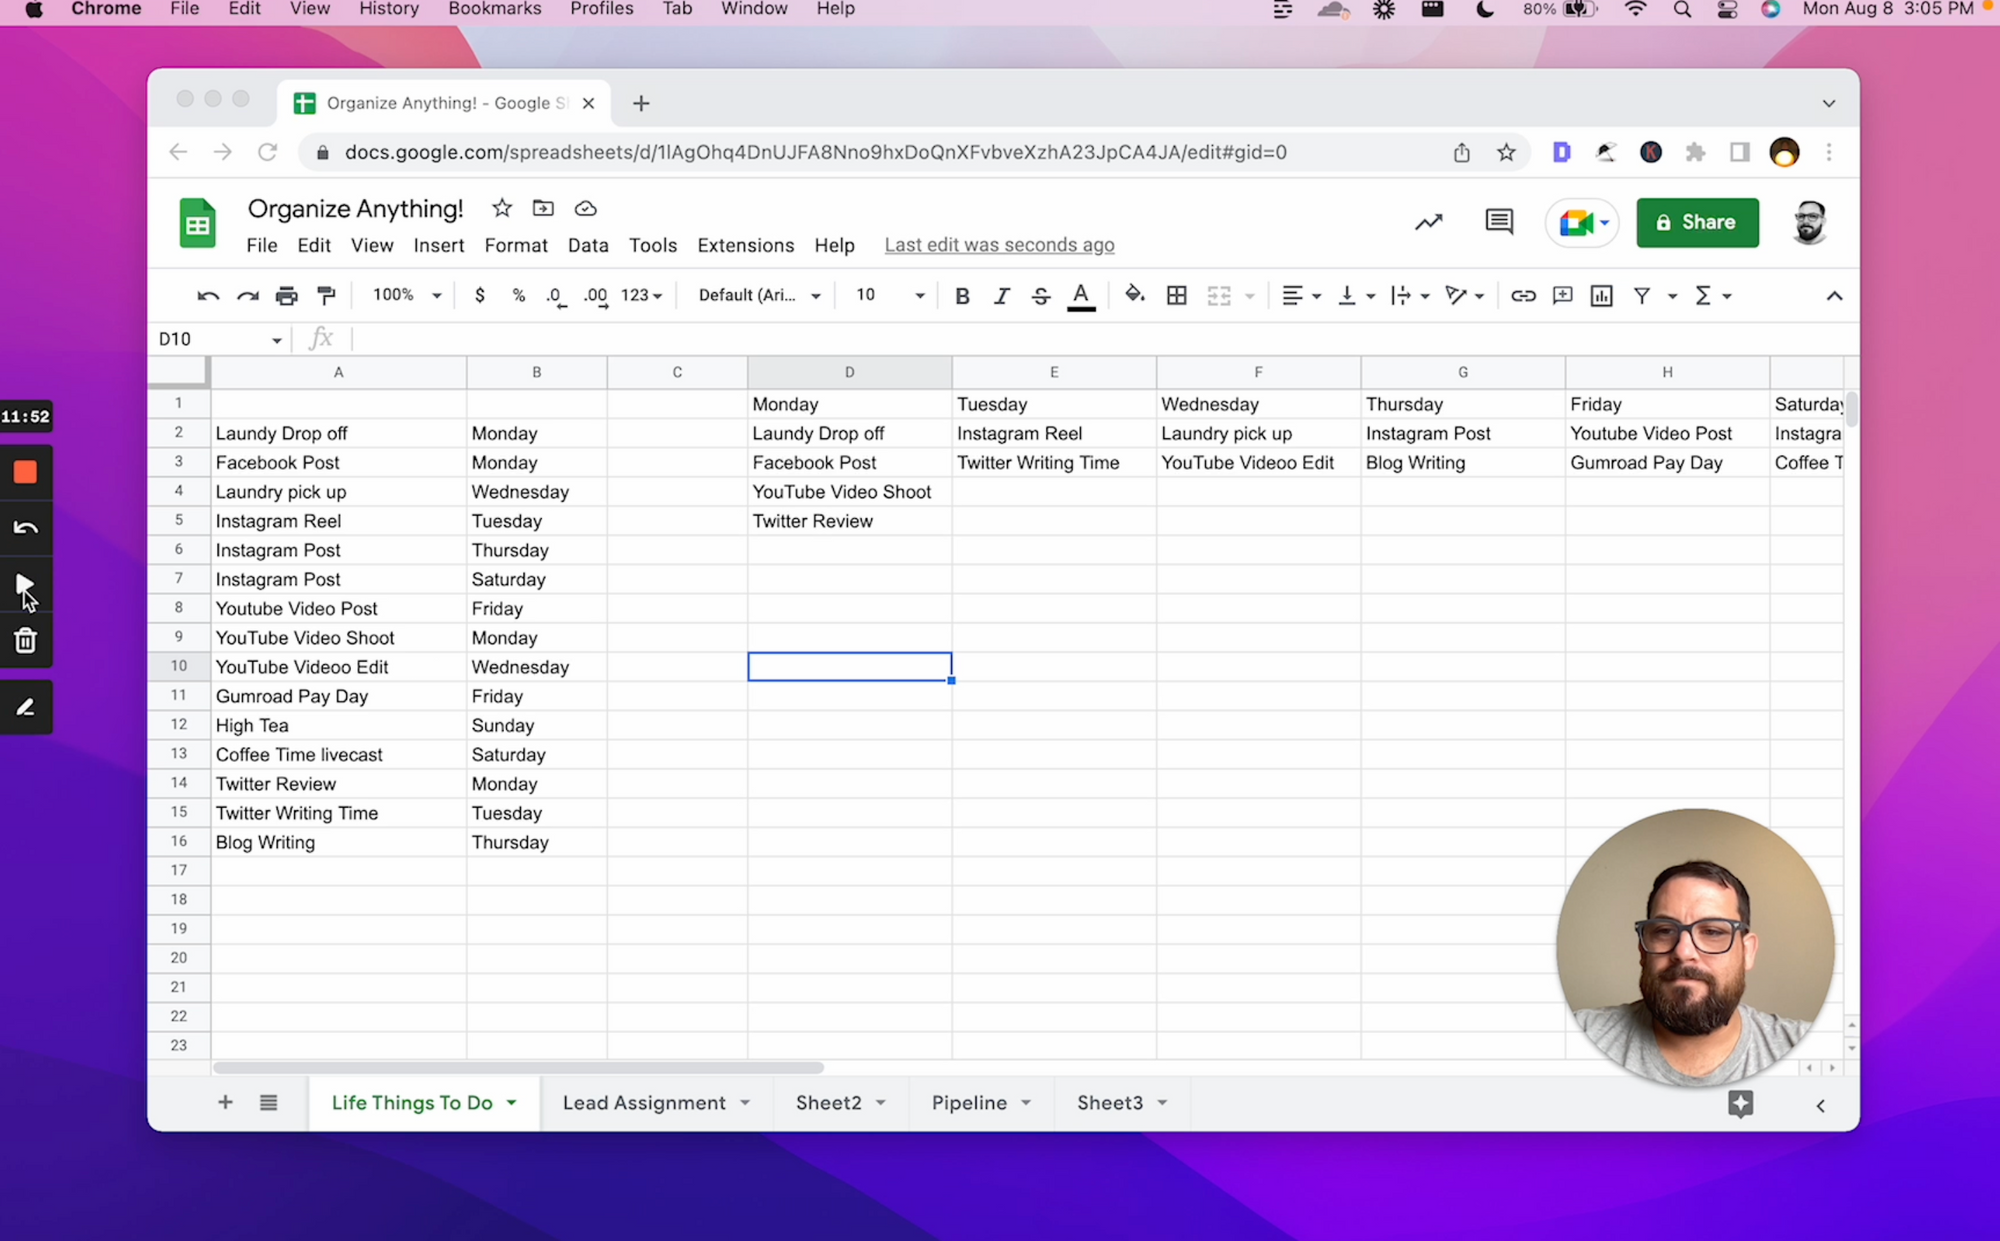
Let's say we have a lot of stuff to do during the week and we just want to assign everything a day. Then we make sure that we have a balanced week. We don't want to have everything we do on Tuesday and then realize we have too much of a busy Tuesday.
So here's how we're going to do it: I'm going to show you a few formulas that we can use.
First off, we need unique, because sometimes we don't know if we got everything, like these days of the week.

I usually try to do this on a separate tab, but just to show you how you can organize these things ¬(and it looks really cool), I'm going to show you the difference between this list here on the left and our Kanban to the right.
We’re going to filter the A column. Their condition is that the B column is equal to D.
=filter(A:A,B:B=D1)
Now we got our A column. But as we copy and paste this, we see these errors. We have to do one extra thing to fix this. We don't want the A or the B column to move, so we just add a dollar sign in front of each of the As and the Bs. But we do want that D column to change as we copy paste it.
Just hit enter, then copy and paste this. Now we have all our entire week assigned here horizontally.
That's pretty cool. So we, we've really front loaded our Monday and our Sunday is clear as day. We only have to deal with high tea and we have some stuff to do on Saturday and Friday.
This allows us to see exactly and go, “Oh, let's move something from Monday to Thursday or Friday. That way, we don't have three empty days.” This is great for work, this is great for life.
Let's go to the next one: Lead Assignment
We have some leads and we're assigning them to different people in our company.
You know, we have them assigned and we're like, “Are we assigning them correctly? Are we using any biases now?”
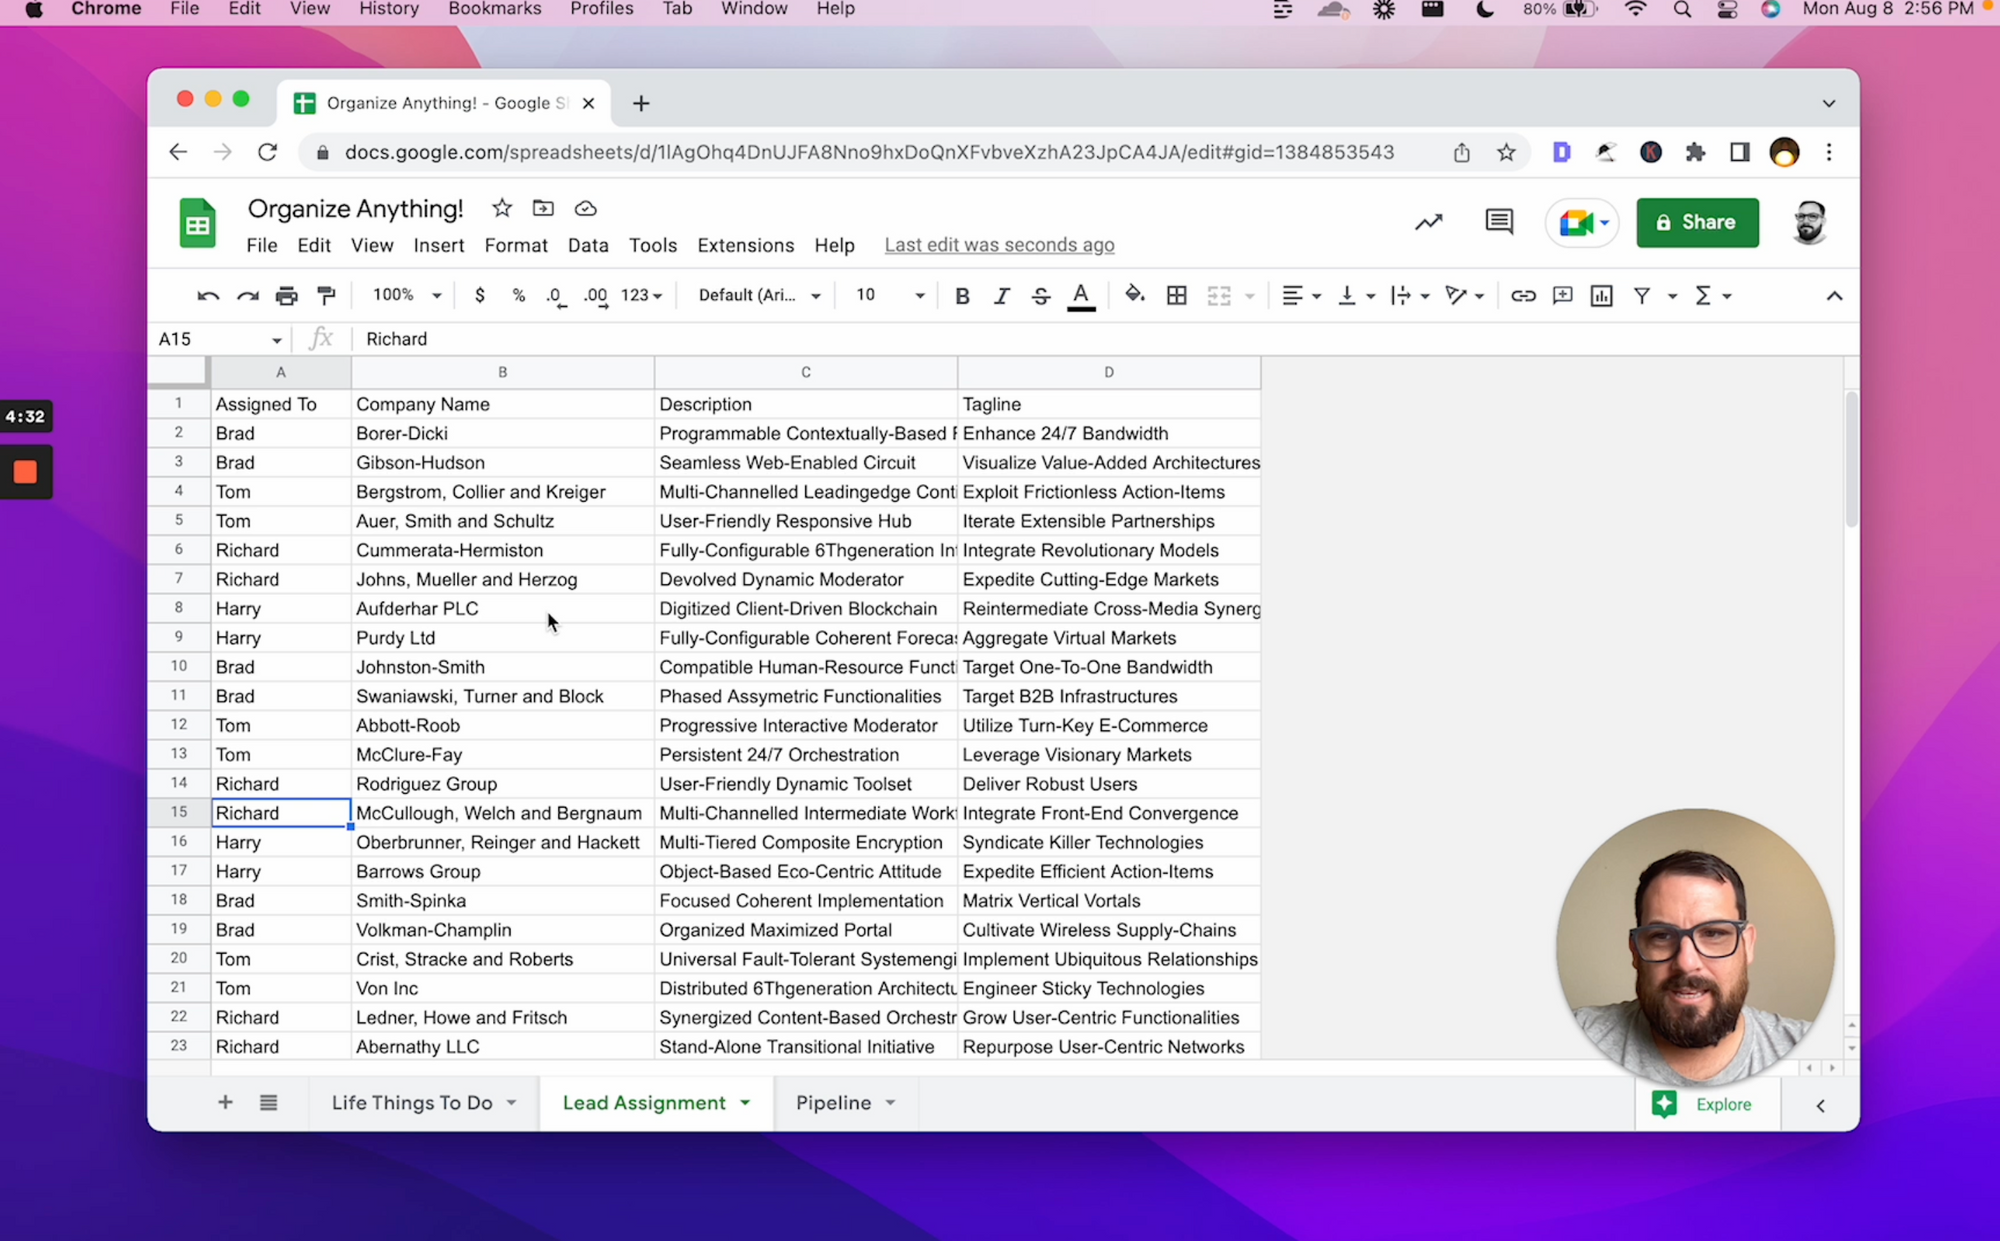
In this case, there a hundred and I really do want to use a brand new sheet. We're going to go back and forth between these tabs.
We don't necessarily have to do this, but what I like to do is use unique, just as a double gut check to see if I spelled everyone's name correctly.
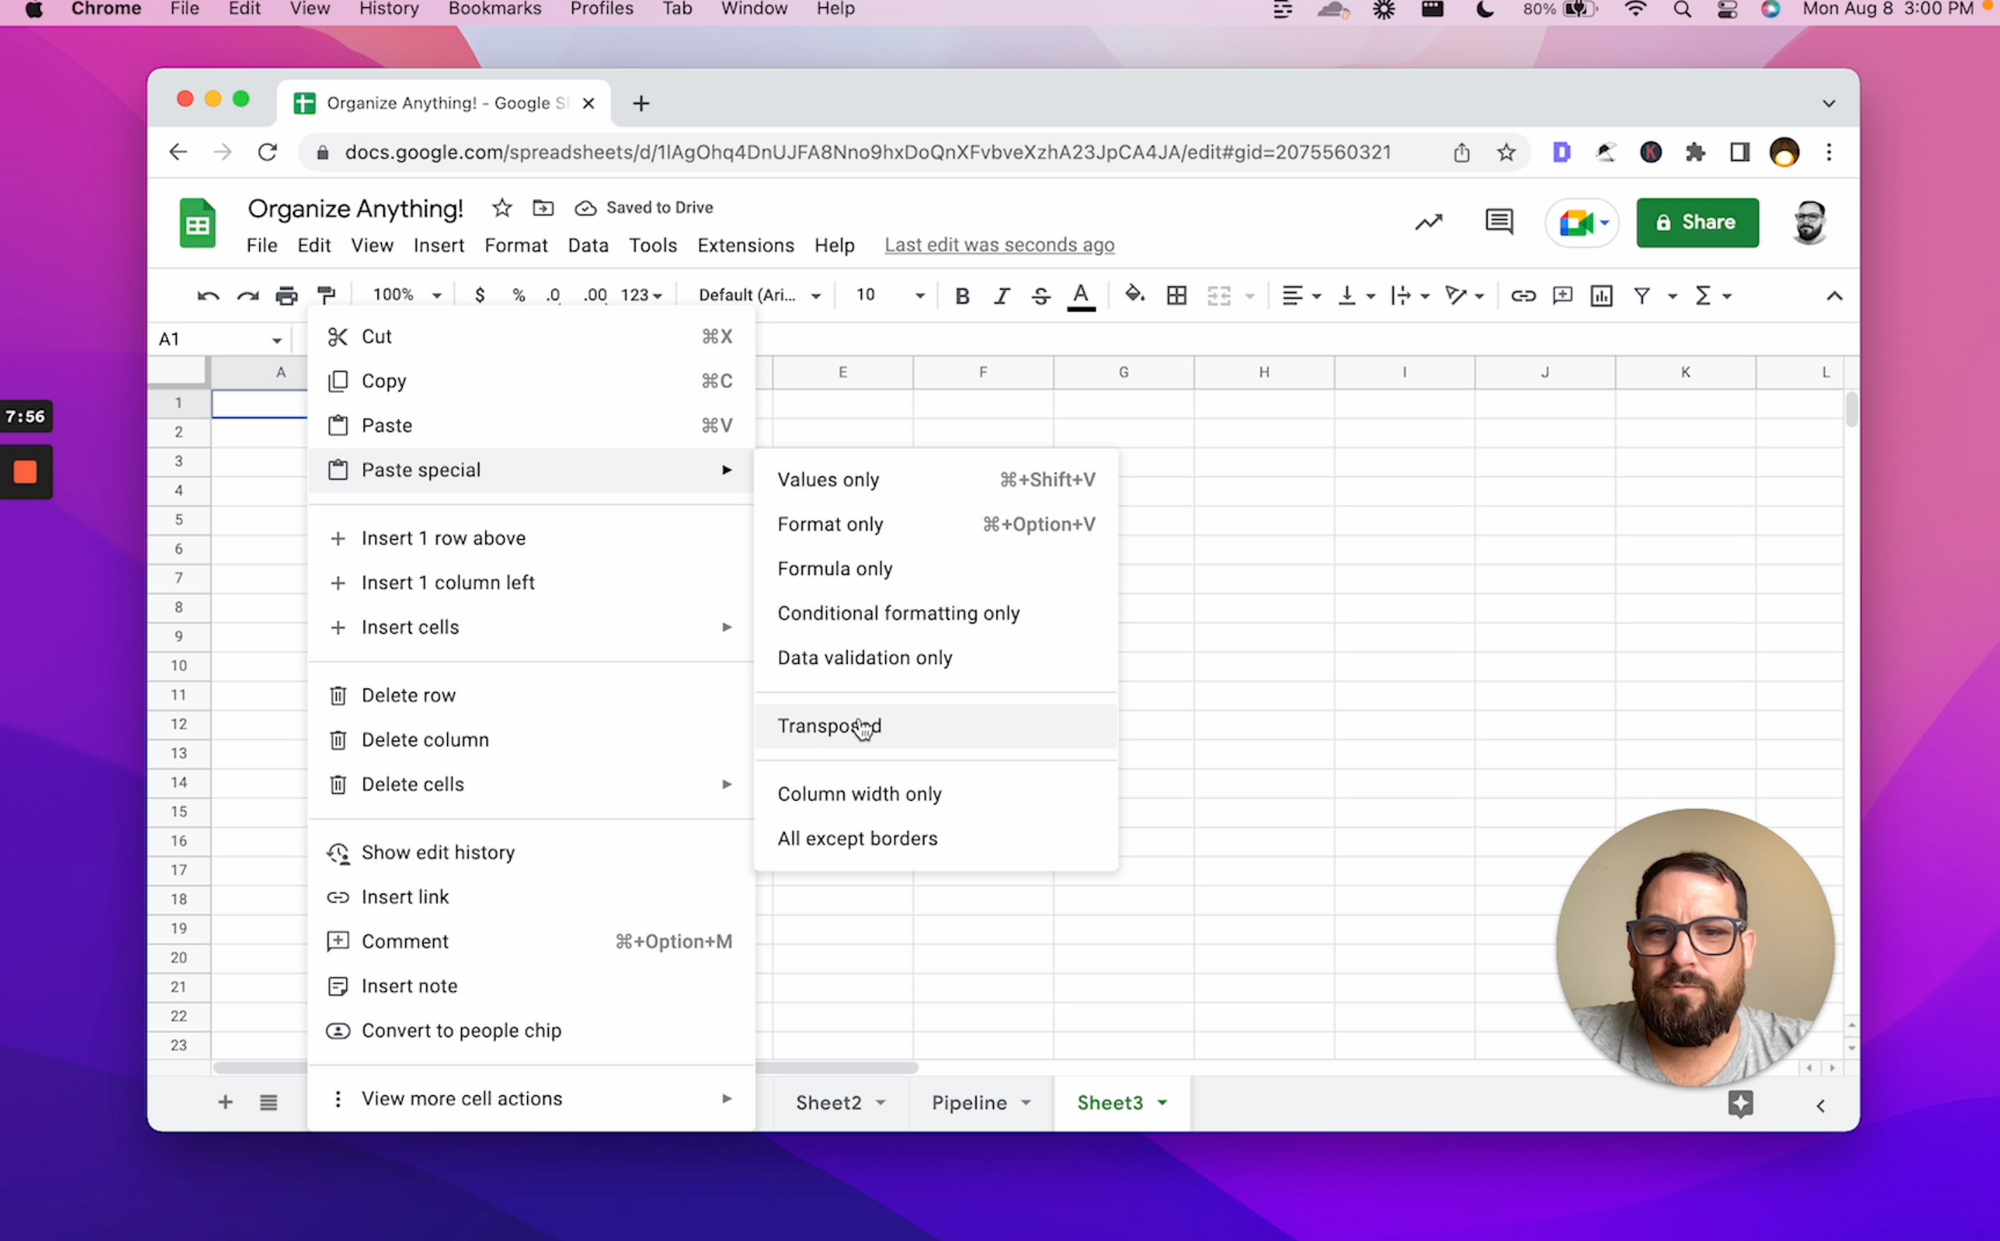
=unique(‘Lead Assignment’!A2:A)Now we're going to transpose again. This time we're going to use it. Then underneath again, we're going to do filter. This time we're going to go back to our Lead Assignment sheet (or tab).
We want to filter the B column (Company Name), but we want to filter it by the A column (?). we just select that a column is equal to… Now what do we do? We just do A1 here, in the new sheet (which is Sheet2 in this tutorial).
Now we have the data under Brad. You know what we're going to do? We're going to go to B and put two dollar signs in front of them. And the As as well, but not the A1. Then we're going to copy and paste.
Now we see everybody's pretty even, except for Harry. He has four. Great!
What if this has hundreds of lines? What could we do?
We could put a little quick counter up here.
=counta(A3:A)Then we copy paste it and we see the count: 24, 24, 24, 28. Perfect!
This is going to help us in the next mission, right?
When we have a sales pipeline, once we start reaching out to these companies, we want to do the same thing, but we don't necessarily just want to divvi them up. We want to see if we are moving appropriately through each of these pipeline.
If we go to Harry and see we have four extras, we want to assign one more to each person. Then everybody has 25.
Next one, we have a Pipeline.
We're going to go through the same exact thing again. We're going to add a new sheet. We're going to go to Unique and double check that first column in the pipeline.
You can apply Transposed if you want these data to be aligned horizontally, like in our previous example.

Okay, same thing. We're going to do filter. We're going to filter the company name by the A column.
Don’t forget to put the dollar sign before the Bs and As.
And now, we have our visual representation of our Pipeline:
- We're going to send more emails than we get.
- We're going to have more follow up than we have followed up twice.
- We're going to have more, followed up twice than it's closed, than lost.
Great! So now same thing we did before. I'm going to add a little row above it and we're just going to do a little count all.
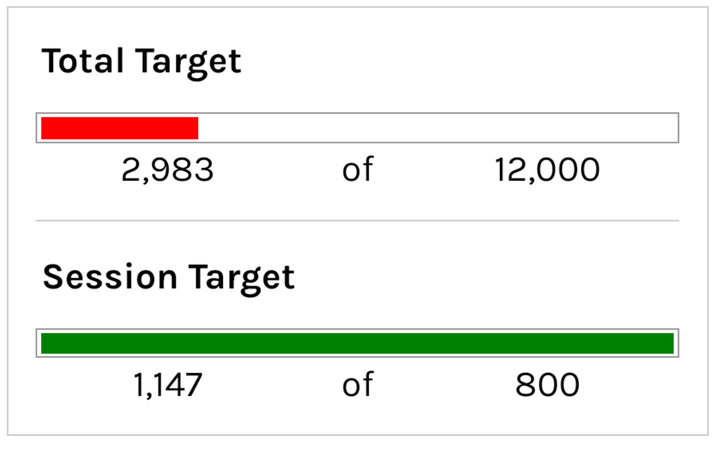
What if now we want to know how many do we close? Add another row above the headers (row 2 in this example). We can do =sum of all of these and we're going to take D1 and divide it by that.
=sum(D1/A1:E1)So now we have a percentage and we know that 13% were closing.
Let's say we want to know how many open leads we have. We don't want to just have emails sent. We want to group all of these together: email sent, followed up, and followed up x2.
We can put them all right here:
=sum(A1:C1)/sum(A1:F1)Right now we have a really cool way to see this Pipeline. We got 74% of our leads we have no resolution on. We have closed or lost 26%. (13 plus 13.) But man, we got a lot of work to do, right?

This Kanban board allows us to see where we are. This pipeline allows us to really dive. But let’s say we want to add the description.
Well, once we do this setup, it's pretty simple to just insert a column. Hit Command Y. Instead of =filter(Pipeline!$B:$B we do !$B:$C. Wow. Now we have the description.
This is a little hard to read, right? We're getting a little lot of data in here, but maybe this helps us trim our pipeline a little bit. Maybe we want to do a little bit better design later.
Once we have these formulas, these are pretty powerful formulas, this filter, unique, and transpose. If we want to keep the pipeline up to date, maybe we add stuff.
This Kanban allows us to really organize anything. We can organize our life, our love life, our work, our leads. We can organize absolutely anything.
Don’t make any sheets. Make Better Sheets.
Watch the video for this tutorial:

Watch these tutorials to help organize your Google Sheets
Get more Google Sheets Tutorials at BetterSheets.co
Join other members! For $19/month you can access over 200 Better Sheets tutorials. Learn Apps Script in under 40 minutes. Design better dashboards. Make your sheets faster and yourself more confident in sheets.