Ken Asks Can We Add Star Ratings in Google Sheets?
Learn to use data validation, emojis, and various scripts for a captivating visual representation of data. Explore easy ways to add star ratings in Google Sheets.

This tutorial answers the question, “How can we add star ratings?” The actual question is a little more involved he was asking one clip star ratings and unfortunately in order to do that I imagine you have to do a little bit of scripting.
You can sort of do that because you can insert an image over cells and then add a script to those. You can create an on-click kind of script where you can change the image.
Why I wanted to answer it in this way with data validation and emojis is because it actually adds a really cool element of reading star ratings to our lists or any kind of data we're trying to get from other people. Maybe we're doing a survey or something. Maybe you want to show some kind of rating system and it could be stars. It could be any emoji. I used emojis here and used a data validation to give you a dropdown.
So technically, the answer is here's a one-two click answer. It's double the amount of clicks you wanted, but it allows us to do a lot of really cool stuff in with this data. I'll go into that once I show you how to do this.
Basically, I created a five- range rating. You don't have to do this. You can actually do this within the data validation items. I'll show you how.
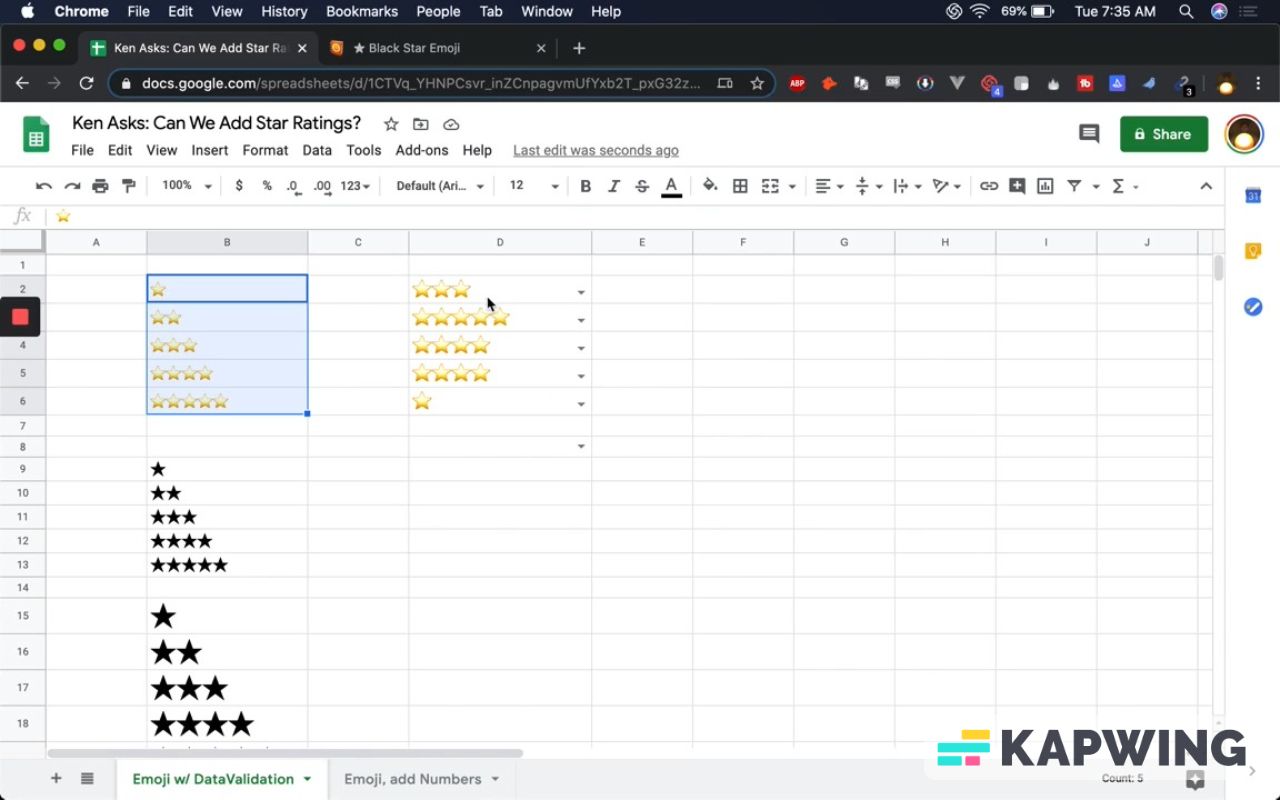
I just copied this black one from Emojipedia. You can also type in “star” and there's a glowing star.
If you’re rating hotel stays, you can use beds. You can just copy that and we can create a literally one to five beds. How would you rate your stay last night?
You can create this list right anywhere on a tab that says “Dropdowns.”
You can go to another tab (a new one) and have some data there.
You want to add a drop down for star rating.
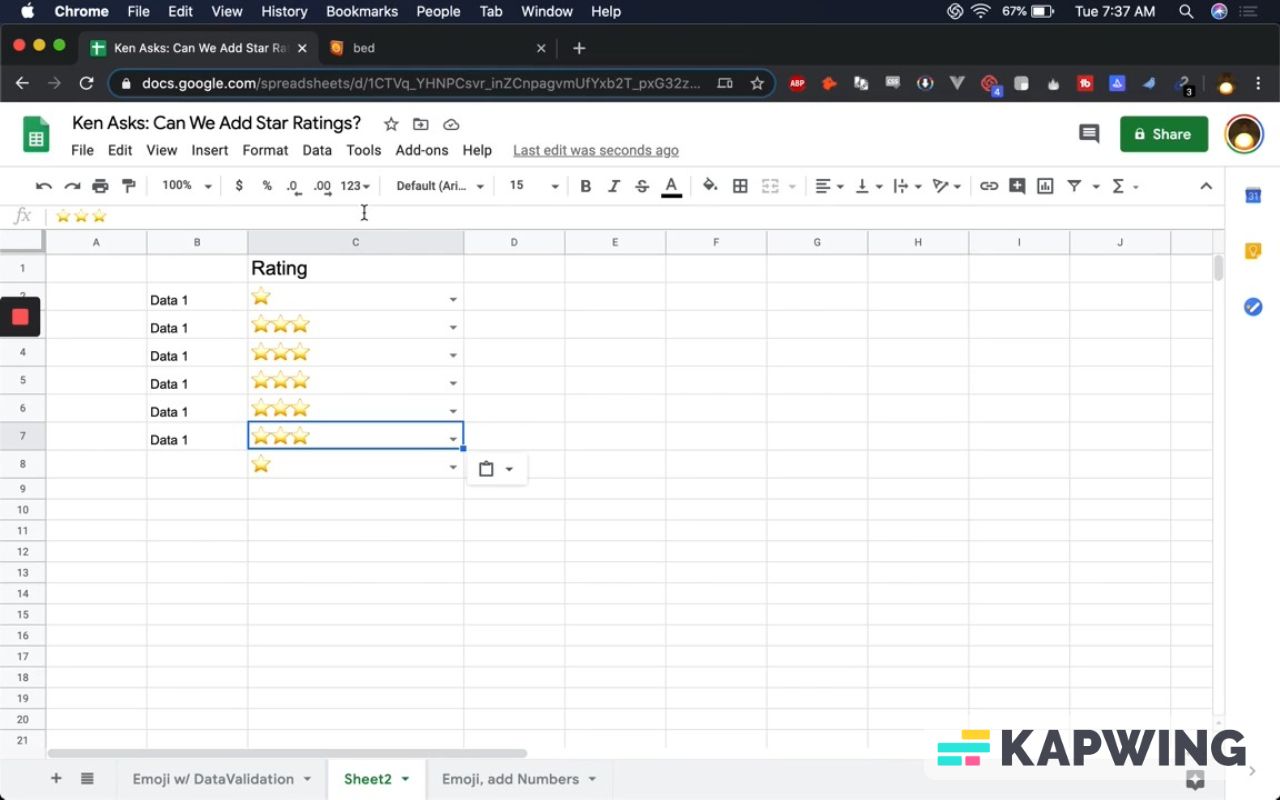
Here's what we need to do we would insert data validation. In the “List from a range” field, we just want to select range B2-B6 (Emoji w/ DataValidation tab). Save that.
And now we can select 1-5 stars.
What if I don’t want to create another tab?
What you can also do if you don't want to have another tab is this: Inside of Data Validation, instead of going for “List from a range”, you can select “List of items.”
Then start inserting emojis, like star emojis. You can do that as well.
We have the same option here, but without having to refer to another page or another range.
What if I want to get data from this?
We may want to gather data from this. But when we try to get the average of these star ratings, we get nothing.
This is because the value of function Average caused a divide by zero error. There's nothing there. It's emojis. They are images; they are not numbers.
We can have that data in a column or in another sheet. We’ll put the data in D2 – D8 for this tutorial. We want to say, “Okay. From this data, we'll get these values and then we want the average.” And here is the average: 2.4 stars.
So how do we get these?
There are a couple ways to do that and one is with vlookup.
If you already have a range of these stars, you can add their corresponding numerical values.
This is a pretty typical way to that I've seen in the past to grab this data. We just create a vlookup.
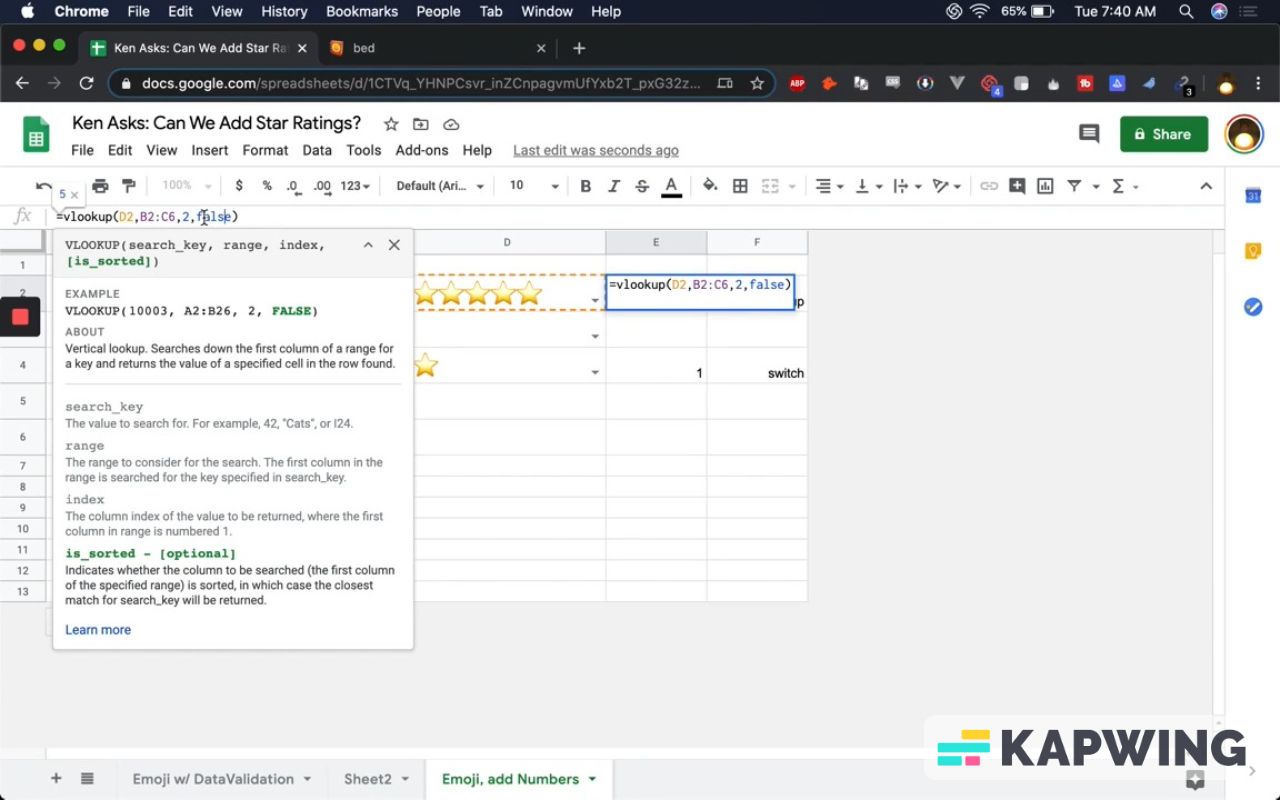
=vlookup(D2,B2:C6,2,false)When you say three emoji stars, you actually go to B2 to C6. Go to second column and find out what that is. So that’s three.
Usually, one of the quickest ways to do it is you need four arguments, one of which will always be false. I always put false. I really don't know why anyone would put true. I think on very, very long amounts of data, putting true helps you do that vlookup faster.
You're just going for the search key, which is the emoji area. You’re going for the range, which is going to be wherever the emoji list is with the numbers. Then you're going to go to the second column
There's another way to do it with switch.
This sort of fun because it you have to just copy paste emojis a lot.
Copy and paste the star emojis in D4-D6 and then type in the switch formula.
The expression is the rating (D5). We will copy this all the way down like we would a vlookup.
What are the expressions?
Switch is giving us a set of case end value.
Cases are what is the thing that it is and what do you want to express it as.
We have to use quotation marks for this:
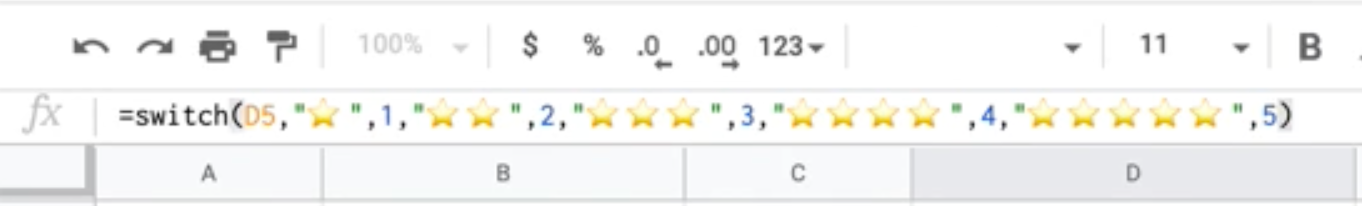
And now when we change this to two stars, we have the number two. When we change this to four stars, we have the number four.
You can actually use different kinds of stars. We can use black stars. We can use beds, balloons, frowny faces.
You can even do something interesting like this: We can say something like, “How was the service?” We can give them corresponding emojis like “Yay!” or “No! Terrible.”
Then we can use the switch formula for this. Enter that formula on the cell beside it (F12 for this tutorial). And whenever you want to use this expression (the frowny face), put -1. On the happy face, put a 1.
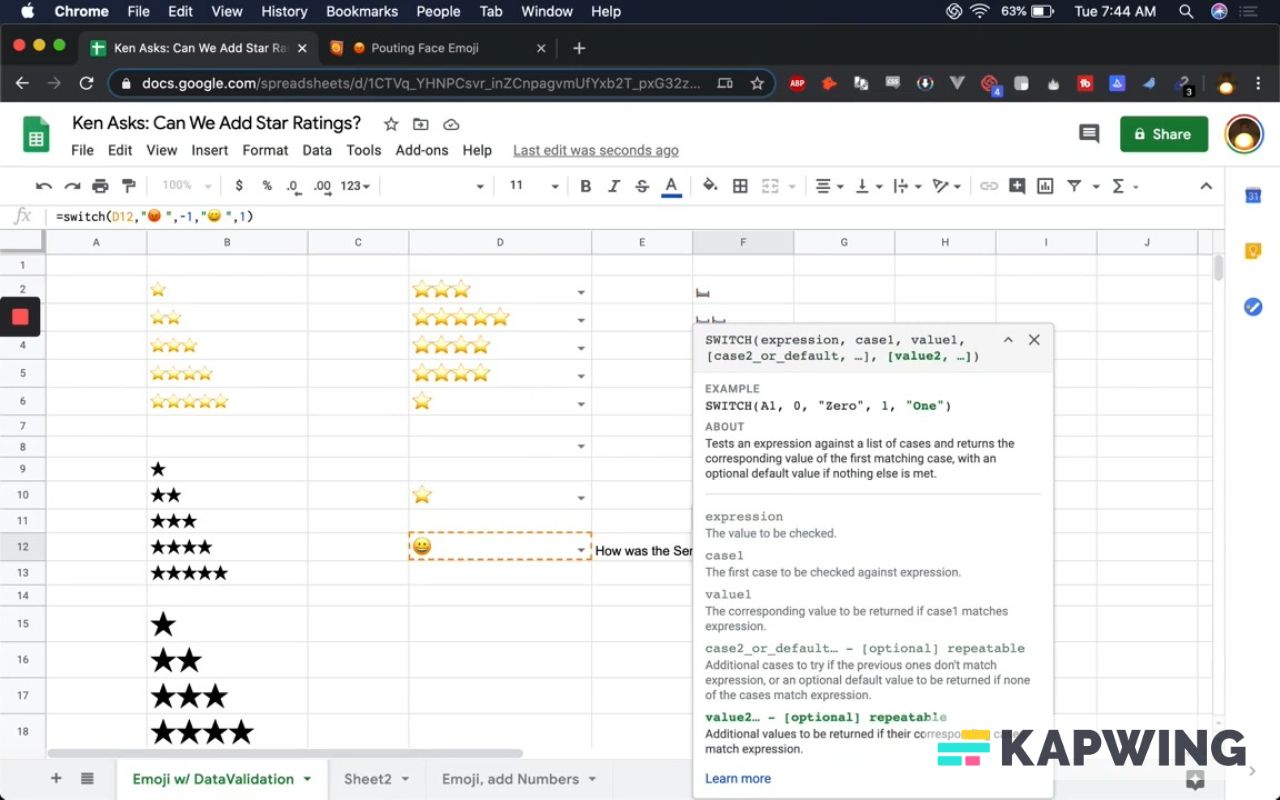
So this is really cool. We can do thumbs up and thumbs down selections. We can then turn that into data.
Here's one thing that's missing and one thing you can do even better.
What happens if you have a data set and you're trying to display that data set to others? You want to take a rating that already exists.
Maybe you downloaded this from a rating site or you already have a rating site and your gathering data for SEO ratings. You're trying to visually represent the numbers 1 through 5 or good and bad.
You can also do the opposite with switch.
Let’s create a new tab, “Switch from Data.” So we have like a bunch of ratings.
Do the same thing as the previous one, except use smiley faces this time, for one through five ratings.
It's literally just the opposite of taking smiley faces or stars. We’re moving them to numbers. We can take numbers and move them to smiley faces.
So now we copy and paste this down and we suddenly have a visual representation of these numbers.
This is pretty darn cool! This really brings a smile to people's faces when they look at your data. They can actually visually represent these numbers.
This is a really, really fun way to take numbers and move them into a visual representation without having to do something like a bar chart or sparkline. It may add whimsy to your sheet.
I hope this was a fun answer for you.
Don’t make any sheets. Make Better Sheets.
Watch the video for this tutorial:
Learn more fun things about Google Sheets:
Let me tell you about Better Sheets
If you enjoyed this tutorial, I have more that you might like as well. Check out more tutorials, templates and tools for Google Sheets at Bettersheets.co
For $19/m you can access over 200 Better Sheets tutorials. Learn Apps Script in under 40 minutes. Design better dashboards. Make your sheets faster and yourself more confident in sheets.